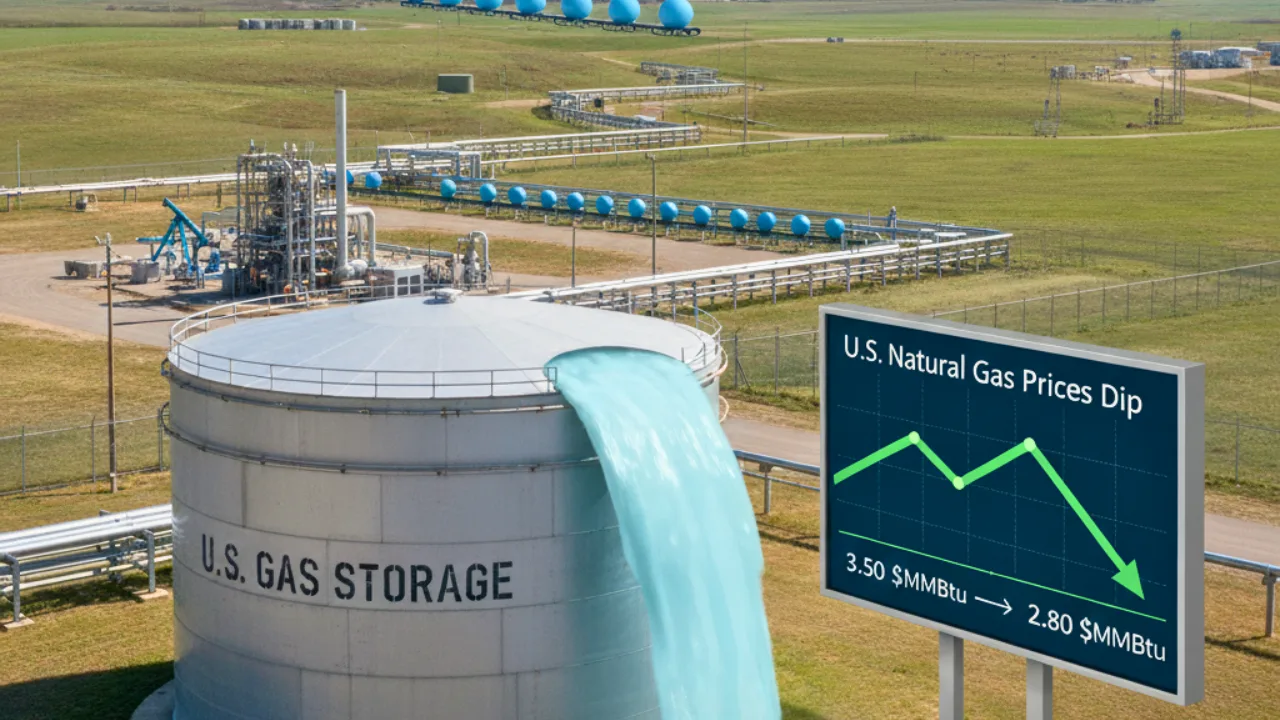
U.S. Natural Gas Prices: U.S. natural gas futures recorded back-to-back losses this week as fresh data from the Energy Information Administration (EIA) revealed a larger-than-expected increase in underground storage. The latest report showed that natural gas inventories rose by 80 billion cubic feet (Bcf) for the week ending October 3, pushing total stocks to 3,641 Bcf. Although this figure sits at the higher end of analysts’ expectations, it remains below the five-year average, signaling a slowing pace of growth even in the face of relatively mild weather across the United States.
Energy experts say this trend indicates a “healthy cushion” heading into the final weeks of the injection season, but the market remains cautious as the heating demand from residential and commercial sectors begins to pick up gradually.
Key Takeaways: U.S. Natural Gas Market Insights and Storage Update
- Weekly Build: Natural gas storage increased by 80 Bcf, compared to 53 Bcf in the previous week.
- Total Stocks: Inventories reached 3,641 Bcf, up from 3,561 Bcf a week earlier.
- Analysts’ Consensus: Expected a 76 Bcf build actual injection slightly exceeded forecasts.
- Five-Year Comparison: Stocks remain 157 Bcf above the five-year average, maintaining a strong supply cushion.
- Price Reaction: Nymex natural gas futures fell 1.9%, settling at $3.269/mmBtu, after earlier trading near $3.31/mmBtu.
- ETF Highlights: Key natural gas-related ETFs included UNG, BOIL, KOLD, FCG, UNL, and HNU:CA.
- Analysts’ Perspective: Despite ample supply, slower inventory growth hints at changing seasonal demand patterns.
EIA Data Reflects Healthy Yet Slowing Inventory Growth
According to the U.S. Energy Information Administration’s weekly report, gas in underground storage rose by 80 Bcf, slightly above the Wall Street Journal survey estimate of 75 Bcf, but below the five-year average build of 94 Bcf for this time of year.
While the increase places current inventories comfortably above historical norms, the pace of injections has noticeably decelerated compared with previous seasons.
Andy Huenefeld of Pinebrook Energy Advisors noted, “While this is still a healthy cushion heading into the final weeks of the injection season, inventory growth has been slower than average even as temperature patterns have been generally mild across the country.”
Also Read: Today’s and Upcoming One Week Gold Rate Prices
This suggests that heating demand, though currently minimal, is beginning to influence market balances as cooler weather approaches.
Market Reactions: Futures Prices Decline
On Thursday, U.S. natural gas futures continued their downward trend for the second consecutive session. The benchmark Nymex natural gas contract dropped by 1.9% to $3.269/mmBtu, after earlier slipping 0.6% to $3.313/mmBtu.
Analysts attribute this decline to the larger-than-expected storage increase, which eased immediate supply concerns.
Eli Rubin of EBW Analytics said in a note, “Stakes were high for this morning’s EIA report following last week’s ultra-bullish 53 Bcf injection. A second bullish surprise may reinvigorate upside but a bearish ‘make-up’ report may pile on to losses.”
As it turned out, the data leaned toward the bearish side, reinforcing selling pressure across energy markets.
Comparing Weekly Trends and Market Expectations
For the week ending September 26, inventories had increased by 53 Bcf, significantly less than the latest 80 Bcf rise. This jump highlights how production and storage efforts intensified in early October.
The consensus estimate of +76 Bcf underscored expectations for a steady build, yet the slightly higher figure hints that supply levels remain robust ahead of the heating season. With total storage at 3,641 Bcf, the market holds a 157 Bcf surplus over the five-year average, a sign of resilience even amid mild temperatures.
European Gas Prices Mirror the Cooling Trend
Across the Atlantic, European natural gas prices also dipped, reflecting improving supply conditions. The Dutch TTF benchmark fell 1.7% to €32.14 per megawatt-hour, according to industry data.
Storage facilities across the European Union are now 83% full, which, though lower than the five-year seasonal average of 91%, is considered sufficient before winter.
Analysts from ANZ noted that the region continues to benefit from strong liquefied natural gas (LNG) imports, as demand in North Asia slows due to high inventories in Japan and recent price hikes.
This international balance in gas flows underscores how global supply chains are adjusting efficiently to seasonal transitions.
Heating Demand Yet to Make a Major Impact
Despite mild weather patterns, early signs of heating demand have started emerging. However, experts emphasize that it still exerts minimal pressure on overall consumption levels.
According to analysts, the coming weeks as colder conditions spread will be critical in determining whether natural gas prices stabilize or continue their downward trajectory.
The residential and commercial sectors are expected to gradually increase consumption, but until a significant drop in temperatures occurs, storage levels are likely to remain comfortably high.
Energy Market Outlook: Stability with Seasonal Watchfulness
As the U.S. approaches the end of the injection season, the market outlook remains cautiously optimistic. High storage levels provide a buffer against sudden demand spikes, but slower injection rates hint at a possible shift once winter heating accelerates.
For investors, the near-term movement of natural gas futures will depend heavily on weather patterns, production rates, and LNG export trends. Analysts say prices may find temporary support if colder weather sets in earlier than expected.
Looking Ahead: Will Winter Heat Up the Gas Market?
The latest EIA report shows the U.S. natural gas market is entering the colder months with solid storage levels and moderate price volatility.
Although futures have dipped following the inventory update, the broader trend indicates market resilience. A balance between supply readiness and emerging demand will shape how prices move in the coming weeks.
If heating demand strengthens and weather conditions turn colder sooner, prices could see a rebound. For now, however, ample inventories keep the market calm and well-prepared for the season ahead.
Spiritual Insight: True Wealth and Knowledge Through Tatvdarshi Sant Rampal Ji Maharaj Ji
While the news shows how natural gas storage and prices rise and fall, it reminds us that all material resources, no matter how abundant, are temporary. Just as energy stored in tanks serves a limited time, worldly wealth and achievements cannot accompany us beyond this life. Tatvdarshi Sant Rampal Ji Maharaj Ji teaches that true security and everlasting fulfillment come from divine knowledge and devotion. By following His guidance, one attains salvation, the ultimate and permanent wealth of life.
Discover the unique spiritual knowledge of Tatvdarshi Sant Rampal Ji Maharaj Ji at www.jagatgururampalji.org and on the YouTube channel Sant Rampal Ji Maharaj.
FAQs on U.S. Natural Gas Prices and Storage Data
1. Why did U.S. natural gas prices fall this week?
U.S. natural gas prices dropped because the latest EIA data showed a larger-than-expected storage build of 80 billion cubic feet (Bcf). Higher inventories suggest sufficient supply ahead of winter, reducing immediate demand pressure and leading to a decline in futures prices.
2. What is the current level of U.S. natural gas storage?
As of the week ending October 3, U.S. underground natural gas storage stands at 3,641 Bcf, which is 157 Bcf above the five-year average. This indicates a comfortable supply cushion entering the heating season.
3. How did analysts’ forecasts compare with the actual storage report?
Analysts surveyed by the Wall Street Journal expected a 76 Bcf injection. The actual increase of 80 Bcf slightly exceeded expectations, signaling stronger storage growth than predicted.
4. How did natural gas futures react to the storage data?
Following the EIA report, Nymex natural gas futures fell by 1.9%, settling at $3.269 per mmBtu. The decline reflects a market response to higher-than-expected inventories and mild weather reducing short-term heating demand.
5. What are European gas storage levels compared to the U.S.?
European natural gas storage sites are currently 83% full, below the five-year average of 91%. However, strong LNG imports and cooling demand in Asian markets are keeping Europe’s energy supply stable before winter.